Fish Data 2019 – Hollandsdiep

Fish data, some will think “why bother, I’ll go fishing anyway”. “Fishing is no science”, well, it might not be, but still data can bring interesting insights.
With 1620 Fish reported thru our app, we collected quite a database, which we processed into the graphs shown below. This second episode shows the 3 days on Lake Haringvliet. The graphs show the amount of fish per hour, against one of the environmental influences on the fish’ activity. Added to the equation is the tidal influence.
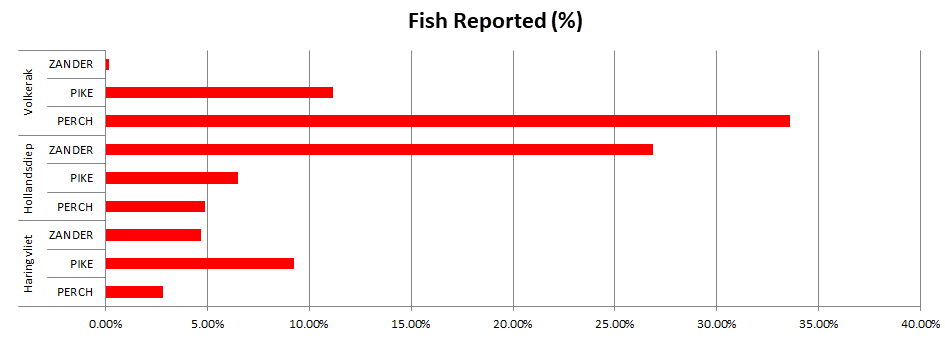
Overall view
| 19/09/2019 Total | 700 |
| Haringvliet | 122 |
| PERCH | 25 |
| PIKE | 77 |
| ZANDER | 20 |
| Hollandsdiep | 262 |
| PERCH | 31 |
| PIKE | 64 |
| ZANDER | 167 |
| Volkerak | 316 |
| PERCH | 230 |
| PIKE | 86 |
| 20/09/2019 Total | 503 |
| Haringvliet | 73 |
| PERCH | 9 |
| PIKE | 44 |
| ZANDER | 20 |
| Hollandsdiep | 180 |
| PERCH | 24 |
| PIKE | 24 |
| ZANDER | 132 |
| Volkerak | 250 |
| PERCH | 190 |
| PIKE | 57 |
| ZANDER | 3 |
| 21/09/2019 Total | 416 |
| Haringvliet | 77 |
| PERCH | 12 |
| PIKE | 29 |
| ZANDER | 36 |
| Hollandsdiep | 177 |
| PERCH | 24 |
| PIKE | 17 |
| ZANDER | 136 |
| Volkerak | 162 |
| PERCH | 124 |
| PIKE | 38 |
| Grand Total | 1619 |
Big Fish
Pikes > 100cm : 42
Perch > 40cm : 143
Zander > 70cm : 31
Lake Hollandsdiep
Lake Hollandsdiep proofed to be the zander lake for this tournament. If you struggled on this lake catching zander, you would definately see that in your end result. The amount of perch caught was relatively low and the sized definately smaller than on the other lakes.
Amount of fish versus Air pressure (mbar)
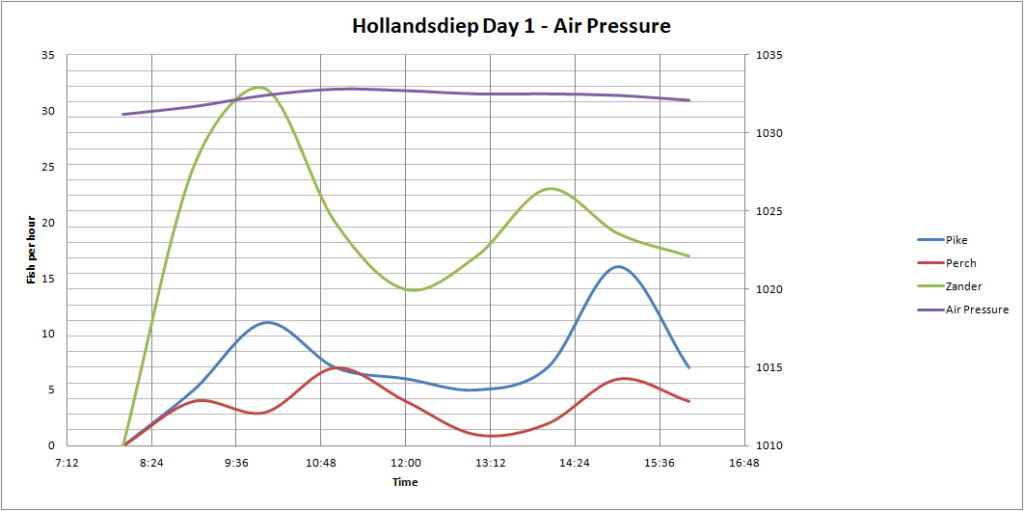
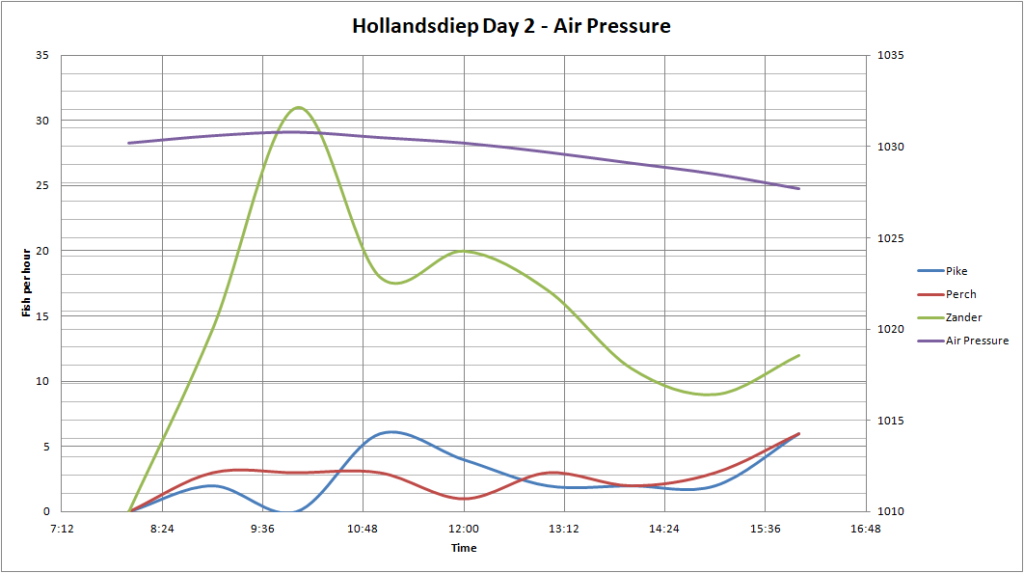
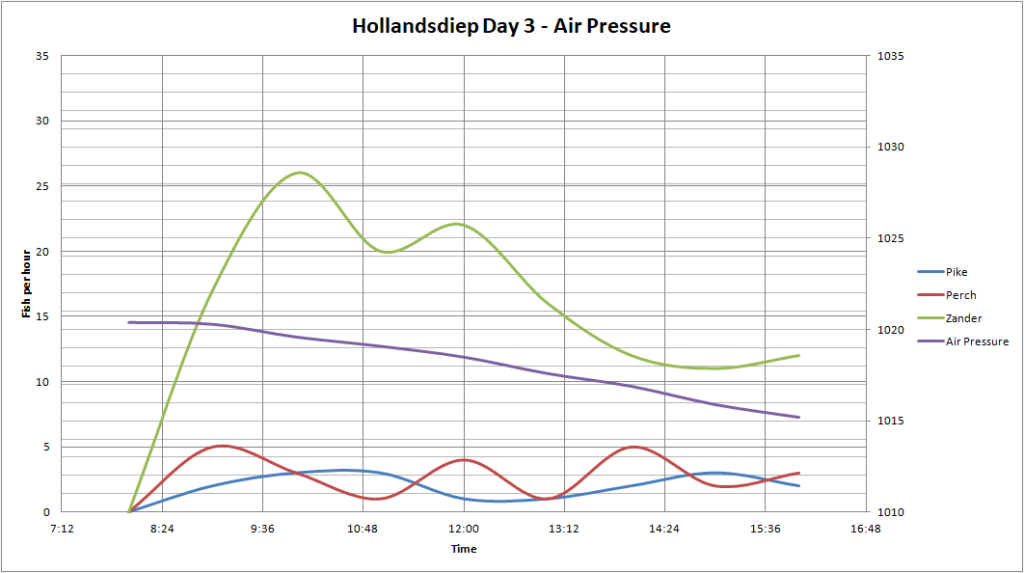
NOTE: No significant changes in air pressure, nor effect on the fishing were seen.
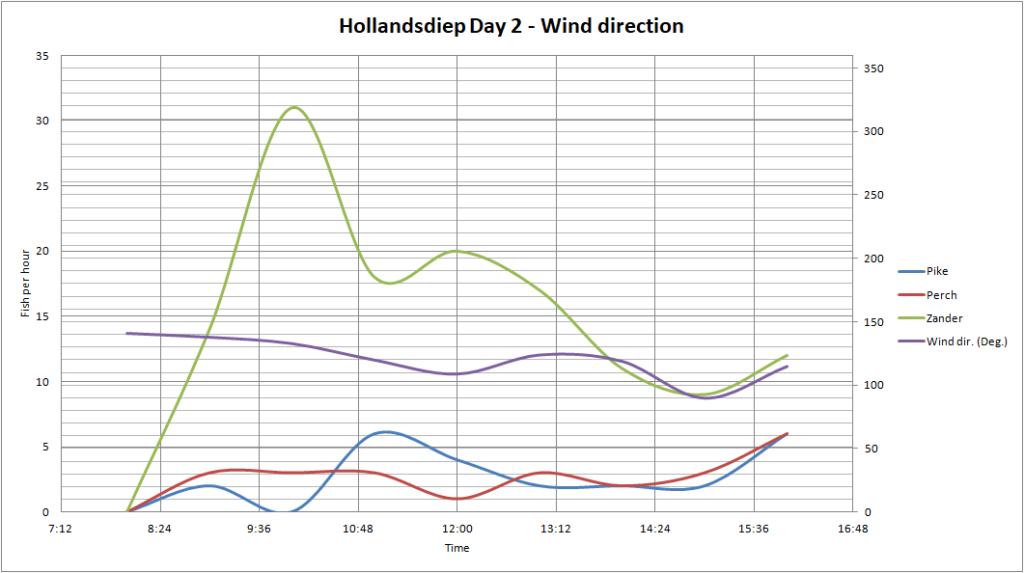
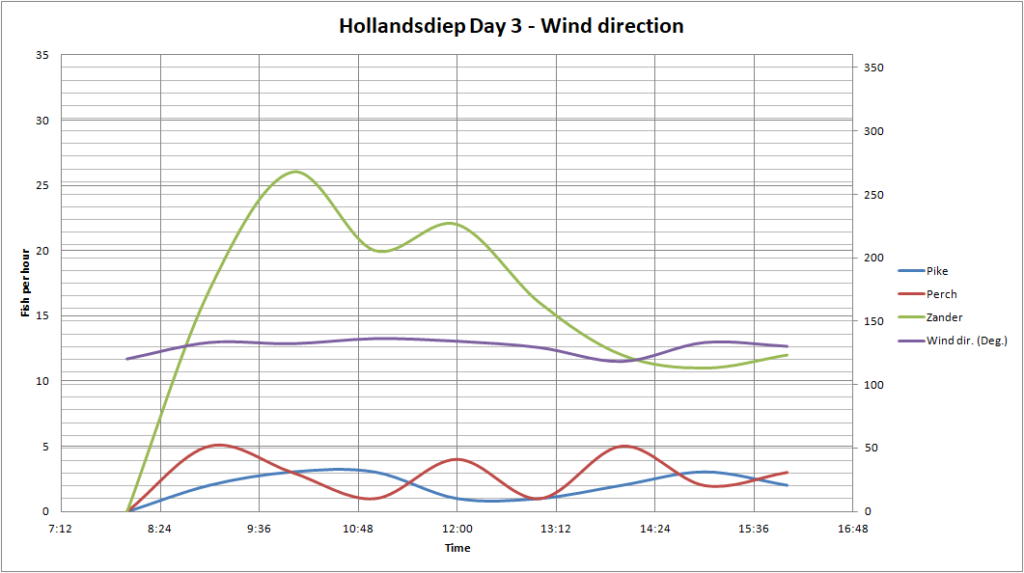
Amount of fish versus Wind direction (deg)
360deg=North
270deg=West
180deg=South
90deg=East

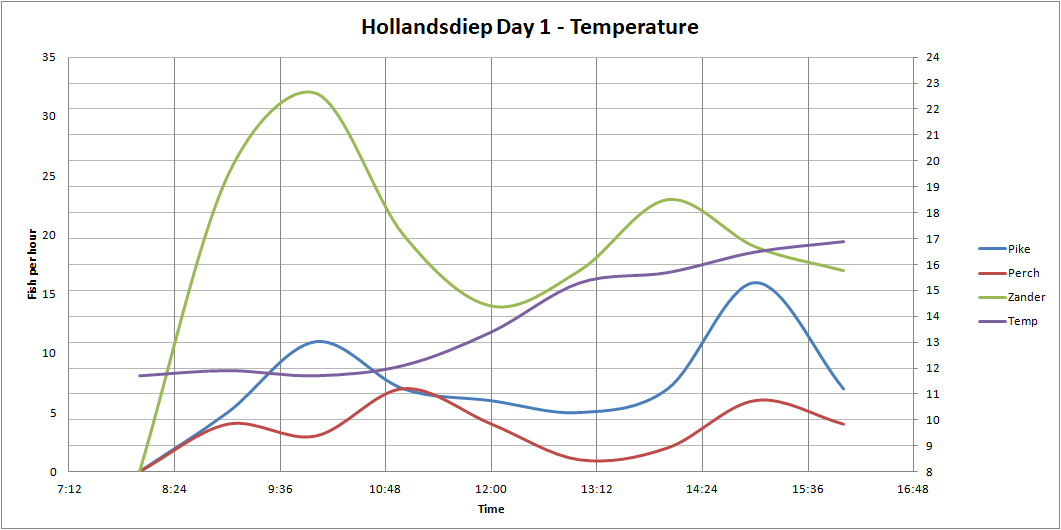
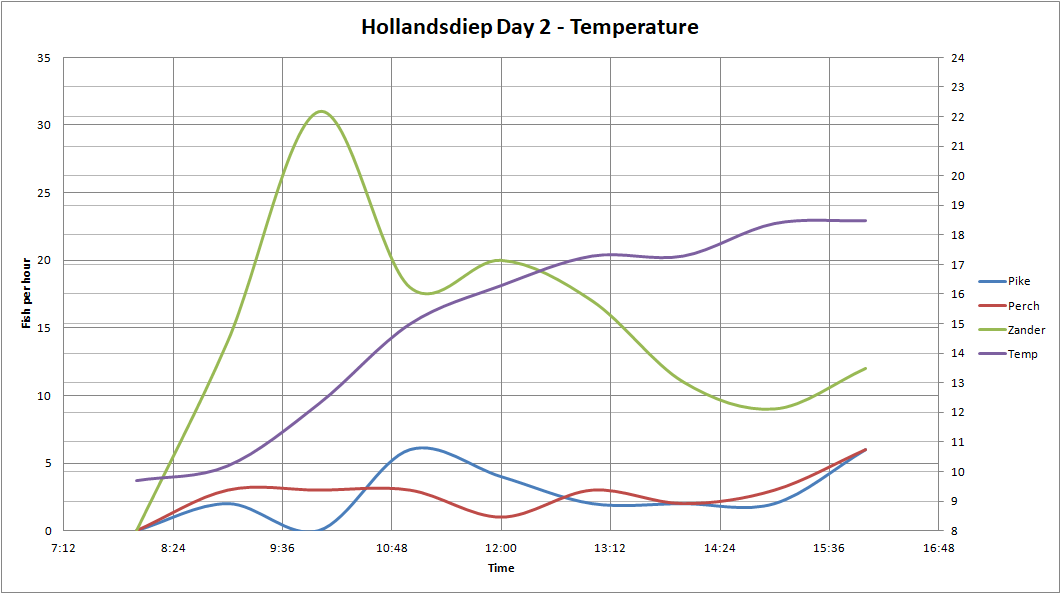
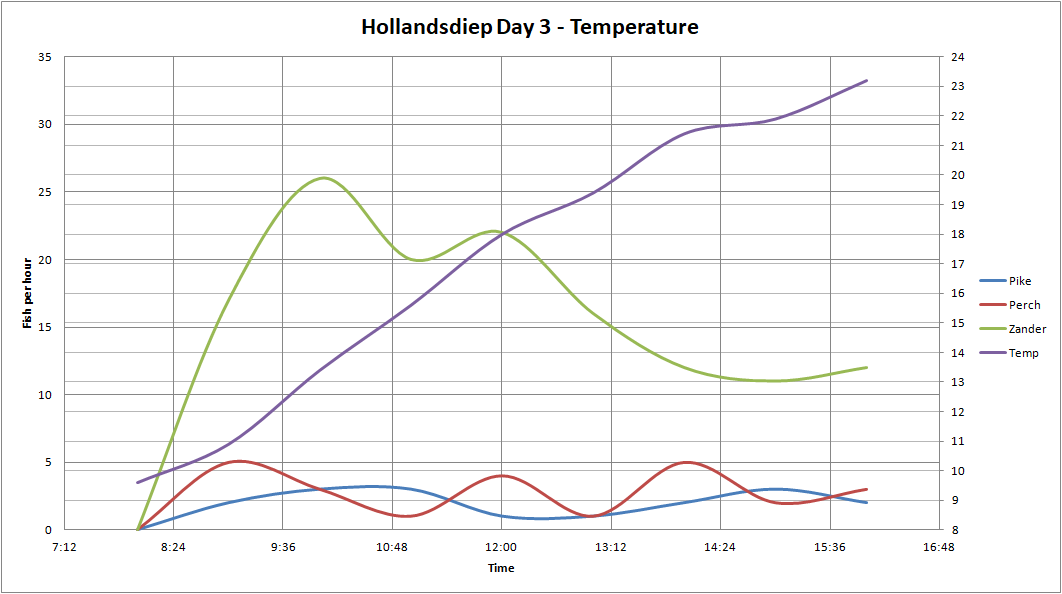
Amount of fish versus Air temperature (C°)
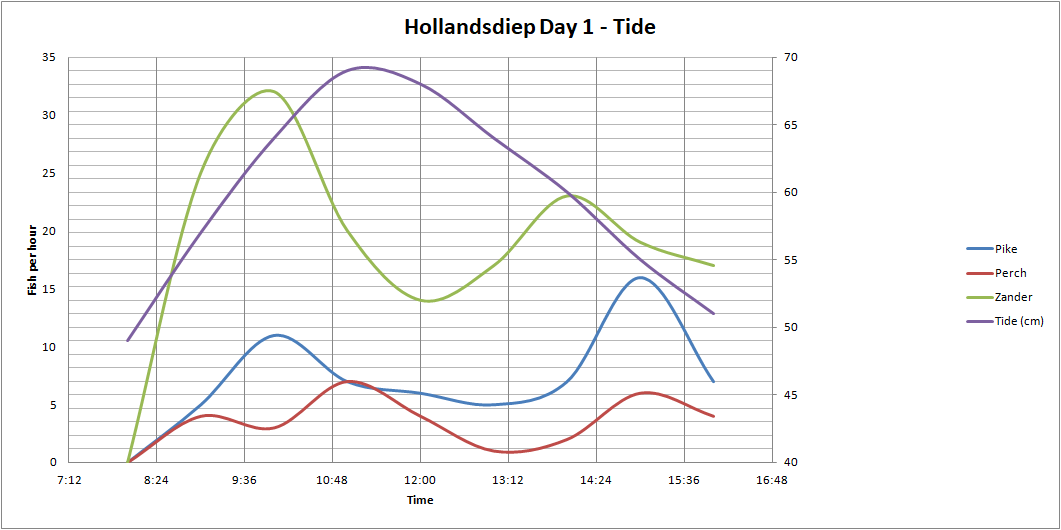
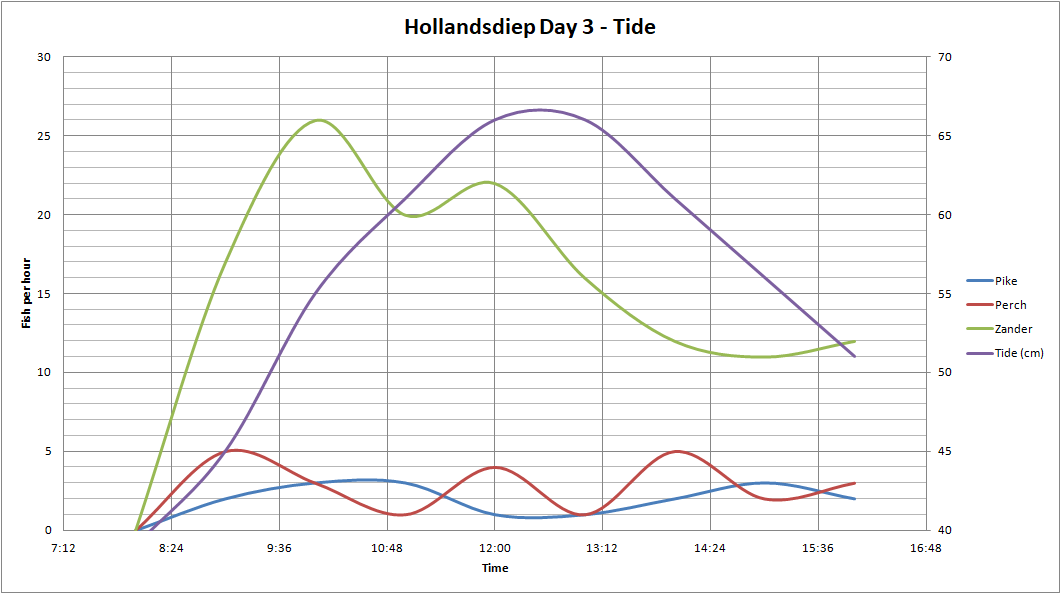
Amount of fish versus Tide (cm)

That’s it for this series. We hope you learned a thing or two to sharpen your tactics for future fishing trips!